TRT Injection Frequency: Daily vs EOD vs Weekly — What Your Blood Levels Actually Do
Same weekly total dose, three different schedules. Here is what actually happens to your peak, your trough, and the swing between them, and why the answer is about half-life, not willpower.
By Jason Jeffries · July 2, 2026
I’m on 150 mg of testosterone a week, split into two shots on Monday and Thursday (the concentration math behind that split is its own post, on TRT math), which I set up to keep my own levels somewhat stable. Lately I’ve been reading more, and I’m leaning toward splitting it further still. This post is the tradeoff behind that: what happens to your peak, your trough, and the swing between them when you split the same weekly dose into more frequent injections.
For the same total weekly dose, more frequent injections produce a flatter blood-level curve: smaller peaks, higher troughs, less swing between doses. Weekly dosing has the biggest peak-to-trough gap; daily has the smallest. Which one is right for you is a prescribing decision, not a math problem. This is about what the tradeoff looks like.
Why frequency changes the shape of your curve, not just how often you feel a needle
Every injection creates a small spike that decays over time as your body clears it. If you inject once a week, that single spike has to carry you the whole seven days: high right after the shot, low right before the next one. Split the same weekly amount into smaller, more frequent doses and each individual spike is smaller, and a new one arrives before the last one has fully decayed. The total drug delivered per week does not change. The shape of the line connecting the highs and lows does.
Same weekly dose, three schedules — modeled side by side
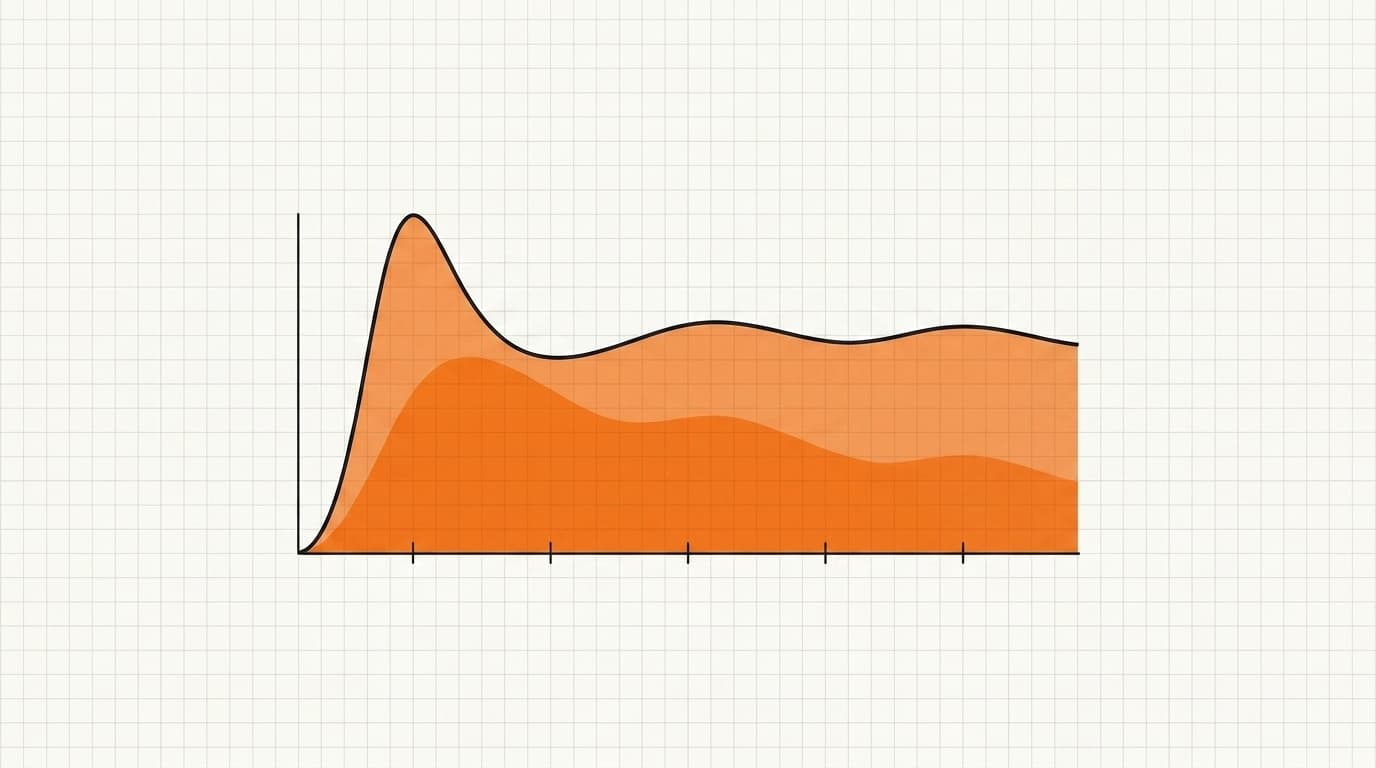
The chart below runs the same weekly total through three schedules: weekly, every other day (EOD), and daily, using a simplified model (instant absorption, a fixed illustrative half-life, doses summed over time). It is not a lab prediction; it is meant to isolate one variable: how splitting the same dose changes the curve.
| Schedule | Shots / week | Modeled peak | Modeled trough | Peak ÷ trough |
|---|---|---|---|---|
| Weekly | 1 | 218 | 119 | 1.83× |
| Every other day | ~3.5 | 178 | 150 | 1.19× |
| Daily | 7 | 171 | 157 | 1.09× |
What actually drives the swing — half-life, not the compound itself
The mechanism here is pharmacokinetics, not a property of any one drug: the shorter the half-life relative to the dosing interval, the bigger the swing. That is why short esters are conventionally dosed more often in the first place, and why a long-acting compound can get away with a longer interval and still stay relatively flat. Swap in a shorter half-life and the same weekly-dosing schedule would show a much steeper drop-off between peak and trough than the modeled curve above.
Real intramuscular or subcutaneous injections have an absorption phase (the level rises for a period after the shot rather than spiking instantly) which smooths the peak somewhat compared to this model. Individual metabolism, injection site, and the specific ester also move the real number. Treat the chart as a shape, not a forecast.
Why some protocols still use weekly dosing anyway
A flatter curve is not automatically the right answer. Weekly dosing means one needle instead of seven, one vial draw instead of daily prep, and a schedule that is far easier to stick to for most people. A protocol you follow consistently usually beats a theoretically flatter curve you skip half the time. This is exactly the kind of tradeoff worth bringing to your prescribing physician with real labs in hand, rather than deciding from a model.
How to see this on your own protocol
The chart above uses one illustrative half-life to isolate the frequency variable. If you want to model a specific compound and dose, the free blood-level simulator runs the same kind of curve for testosterone esters, estradiol, GLP-1s, and peptides. Pick a compound, set a dose and schedule, and see the modeled peak, trough, and shape for that specific case. Stackeddd logs your actual injections against that same engine so the chart tracks what you did, not just a plan.
Where I’m at with my own split
Everything above is why I’m leaning toward splitting my own dose into smaller, more frequent shots than my current two a week. It comes down to one thing: a lower peak.
Splitting the same weekly dose into smaller, more frequent injections lowers the peak blood level and smooths the peaks and troughs, which is well established. A lower testosterone peak plausibly means a lower estradiol peak, and it’s a commonly cited reason to raise injection frequency before adding an estrogen blocker. Robust human-trial evidence is limited, though, and at the same weekly dose it mainly blunts the peak and swing rather than guaranteeing lower total estrogen. It’s a plausible, widely-used strategy, not a settled law, and a decision to make with a prescriber via bloodwork. I log my own shots against the same simulator linked above, so if I change my split, I will see the shape shift before I see it in a lab report.
Frequently asked questions
Does injecting more often lower my average level?
No. The average stays about the same for a given weekly total dose, because it is set by your clearance rate, not by how the dose is split. What changes is the swing around that average: more frequent, smaller doses produce a flatter line; fewer, larger doses produce bigger peaks and deeper troughs.
Why do some clinics still prescribe weekly injections?
Convenience and adherence. One injection a week is easier to remember and requires fewer needles, vials, and injection sites than daily or EOD dosing. For a lot of people that tradeoff is worth a bigger swing. It is a real clinical decision, not a mistake.
Does the ester or compound change how much frequency matters?
Yes. The shorter a compound’s half-life, the more the swing shows up between doses, which is exactly why short esters are typically dosed more often in the first place. A very long-acting ester already has a flatter curve even at longer intervals, so switching it to daily dosing buys less stability than doing the same for a shorter one.
Is this chart based on my actual labs?
No. It is a simplified model (same weekly total dose, an illustrative half-life, and instant absorption) built to show the shape of the tradeoff, not to predict your number. Real levels depend on the specific ester, your injection site, and your own metabolism. Lab work is the only way to know your actual levels.
Should I change my injection frequency based on this?
No. Frequency is a prescribing decision between you and your physician, weighed against your labs, your symptoms, and your ability to stick to the schedule. This post explains the mechanism so that conversation is easier to have. It is not a recommendation to change anything on your own.
Sources
- The curves here are superposition of single-dose exponentials at steady state, which is standard first-order pharmacokinetics: the ratio of half-life to dosing interval sets the peak-to-trough swing, and nothing else in the model does. That is arithmetic rather than a claim, and the shape follows from it.
- The half-life used for testosterone cypionate is the labeled terminal figure of roughly 8 days. Depo-Testosterone clinical pharmacology (Pfizer). For why that number differs from the parameters a depot-release simulator uses, see the ester comparison .
- What this page deliberately does not claim: that a smoother curve produces better symptom control, or better bloodwork. Smoothing peaks and troughs is a mathematical consequence of more frequent dosing. Whether it makes someone feel better is a separate question, it varies between people, and it is a conversation for a prescriber.
This is educational information, not medical advice. Injection frequency is a prescribing decision: talk to your physician before changing your protocol.

Written by
Jason Jeffries
Founder of Stackeddd. Data analytics by day (12 yrs), training for 20, juggling a full-time job, family, and app development. I run TRT and peptides myself, and I built Stackeddd because my whole tracking system was a notebook in a drawer in my bathroom. I’m not a doctor and none of this is medical advice.
STACKEDDD
Track it instead of guessing.
Doses, bloodwork, and an AI coach grounded in your own data — free to start, on the App Store and Google Play.